CellML2Dot
CellML2Dot is a little utility I wrote to generate dot files from CellML models which can then be used by Graphviz and compatible graph/network software to visualise model hierarchies and variable connections. This can be useful when trying to track down problems with your model. It will also do some model validation which might be helpful.
Executing CellML2Dot without any arguments gives the usage information:
$> CellML2Dot
ERROR(main): Missing input file URI
CellML2Dot 0.1 - revision 223M - Fri Jul 11 10:32:17 NZST 2014
Copyright (C) 2007 David Nickerson.
This is free software; see the source for copying conditions. There
is NO warranty; not even for MERCHANTABILITY or FITNESS FOR A
PARTICULAR PURPOSE.
Usage: CellML2Dot [options] <input file>
Perform a simple check of the given CellML file and write out dot files.
Available options:
  --help             Display help and exit.
  --version          Display version information and exit.
  --quiet            Turn off all printing to terminal.
  --debug            Mainly for development, more occurances more output.
  --dot-file-base=<file>  Base name for dot format files.
  --no-component-hierarchy  Do not create the component hierarchy graph.
  --no-variable-connections Do not create the variable connections graph.
  --no-flat-model Do not create the flattened model graph (CellML 1.1 only).
The options are relatively straightforward, but have a play to tweak as you need. Common usage is:
$> CellML2Dot --dot-file-base=/tmp/model- path/to/sine/sin_approximations_import.xml
- which will produce the three files:
/tmp/model-component-hierarchy.dot- the actual CellML component hierarchy;/tmp/model-flattened-model.dot- the flattened model graph (components); and/tmp/model-flattened-variable-connections.dot- the flattened model with all the variable connections (this is the most complicated graph to visualise).
Graphviz has a number of different tools for creating diagrams from the graph descriptions in the DOT format. The standard dot tool works quite well for the component hiearchy graphs. For example:
$> dot -Tpng -O model-component-hierarchy.dot
produces the image:
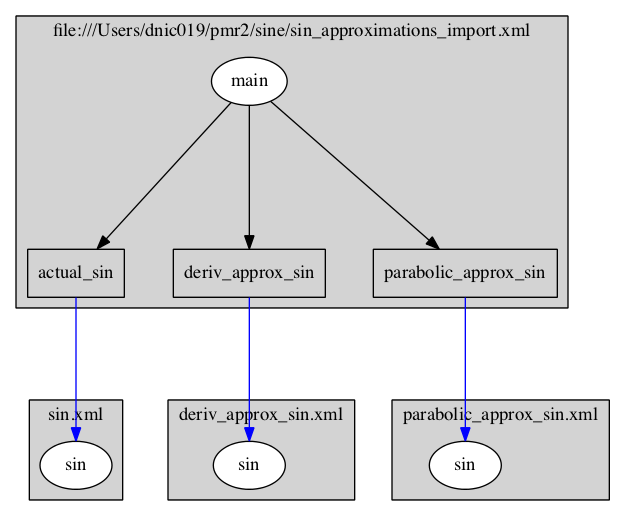
where you can see the top-level model imports components (blue arrows) from the child models via relative URLs. The black arrows indicate the encapsulation hierarchy. Then:
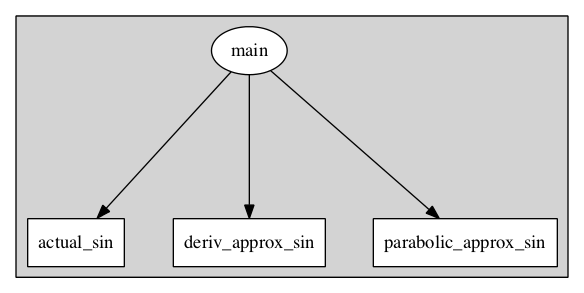
$> dot -Tpng -O model-flattened-model.dot
shows the flatened model’s encapsulation hierarchy:
The variable connection graph is normally a bit model complicated for detailed models, so dot doesn’t always give a useful image. In that case it is worth playing with fdp:
$> fdp -Tpng -O model-flattened-variable-connections.dot
produces the image:
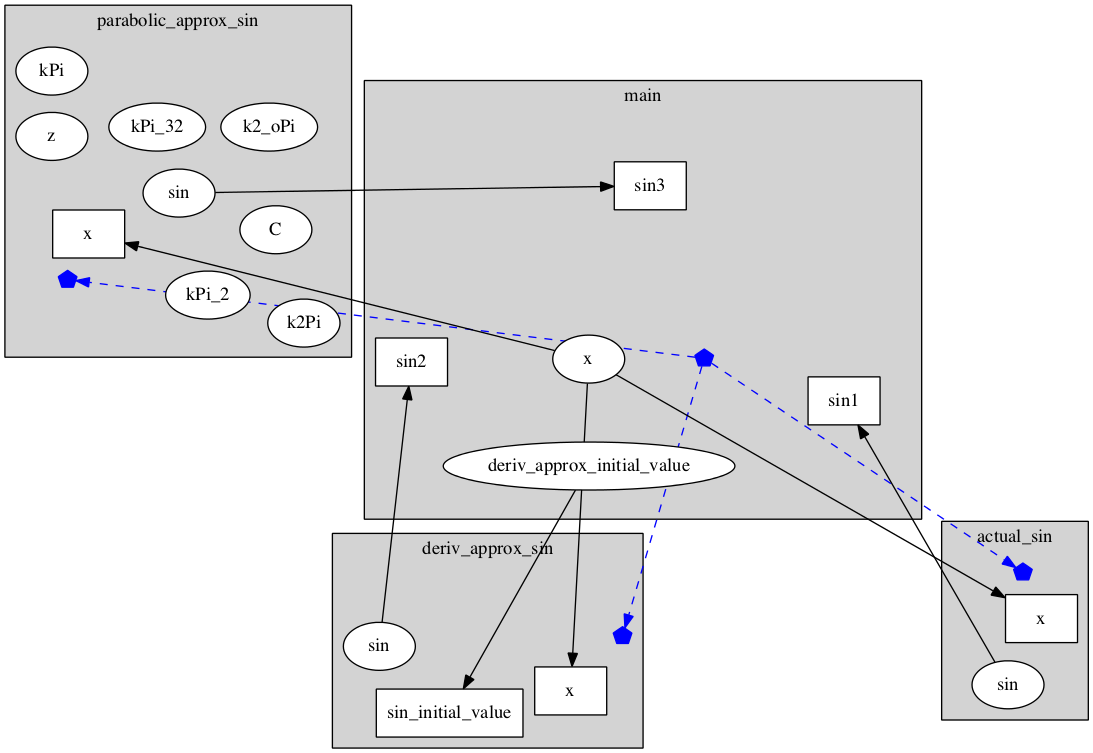
where the blue line is showing the component encapsulation hierarchy. For really complicated models, these diagrams can end up being a real mess. To help with that, I have Perl script which lets you extract specific variables of interest and just look at the connections for those variables. It may work for you.